The Lyrics Board
Are songs getting more repetitive?
People of the older generation (a bracket I suppose I’m quickly moving towards) often complain that music now isn’t as good as it was back in their day. One frequent aspect of the griping is the idea that music is getting more repetitive. Unlike most subjective complaints about music this is something that we can actually test empirically.
To do this I went out and got some data on song lyrics. Looking around online I found the lyrics to all songs that have charted in the Billboard Top 100 1964-2015,
| Rank | Song | Artist | Year | Lyrics | |
|---|---|---|---|---|---|
| 0 | 1 | Wooly Bully | Sam the Sham and the Pharaohs | 1965 | Wooly bully wooly b... |
| 1 | 2 | I can't help myself (sugar pie, honey bunch) | Four Tops | 1965 | Sugar pie honey bunch you know that I love yo... |
| 2 | 3 | I can't get no satisfaction | The Rolling Stones | 1965 | I can't get no satisfaction, I can't get no ... |
| 3 | 4 | You were on my mind | We five | 1965 | When I woke up this morning you were on my mi... |
| 4 | 5 | You've lost that lovin' feelin' | The Righteous Brothers | 1965 | You never close your eyes anymore when i kiss... |
So let’s dig in to this data and see what we can see. For instance are songs getting longer? Let’s split the lyrics into words and count how many there are
df["Length"] = df.Lyrics.str.split().apply(len)
df.groupby("Decade").Length.mean()
| Decade | Length |
|---|---|
| 1960s | 199.603070 |
| 1970s | 233.740659 |
| 1980s | 272.368697 |
| 1990s | 365.427966 |
| 2000s | 464.262076 |
| 2010s | 412.250847 |
So it looks like songs are getting longer at least, not discounting the small downturn we’ve got in the last 5 years of data. This is a pretty crude measure though, just looking at how many words is in a song doesn’t tell us anything about how repetitive it is. One thing that we can look at is how many different words are in a song
df['Unique Words'] = df.Lyrics.str.split().apply(set).apply(len)
df.plot(x='Year', y='Unique Words', kind='scatter')
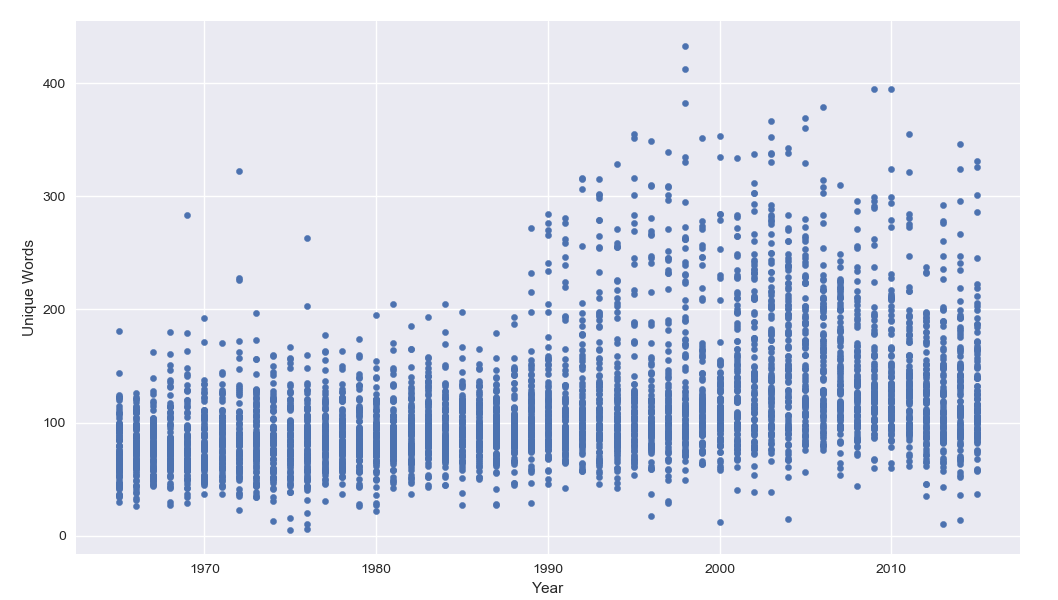
Cool! It seems that songs actually are getting less repetitious, songs today contain more different words than they did 50 years ago. We can see that there seems to be a big shift in the early 90’s, and my hunch here is that this is because of the rising popularity of rap. This is interesting, but it is actually a kinda crude metric for repetition.
A cleverer way to measure how much repetition there is in a string is to see how easily that string can be compressed. And the nice thing about this is that it doesn’t require that a word be repeated exactly for us to compress it; that is ‘love’ and ‘loving’ aren’t the same word, but a good compression algorithm will notice that they’re very similar and use this repetition in its compression.
We can easily apply compression to our lyrics, and see what we get
import zlib

def compress(x):
    return zlib.compress(bytes(x, 'utf8'))

df['Compress Length'] = df.Lyrics.astype(str).apply(compress).apply(len)
The full-size plot is here, it’s a little easier to use.
Now the picture looks a little different. What I’ve plotted here is “compression ratio”, which is the length of the song pre-compression / length post-compression, and we see that there’s a trend towards songs being more compressible – and so, we infer, more repetitious. One thing you’ll notice is that the songs that we find hard to compress are those with very few lyrics. The least compressible song is Also Sprach Zarathustra by Eumir Deodato, which I hadn’t heard of before, but is a mostly instrumental track and since it doesn’t have many lyrics it’s hard for the compression algorithm to find repetition.
Just taking two decades, the first and the last, we can plot up the distribution of compression
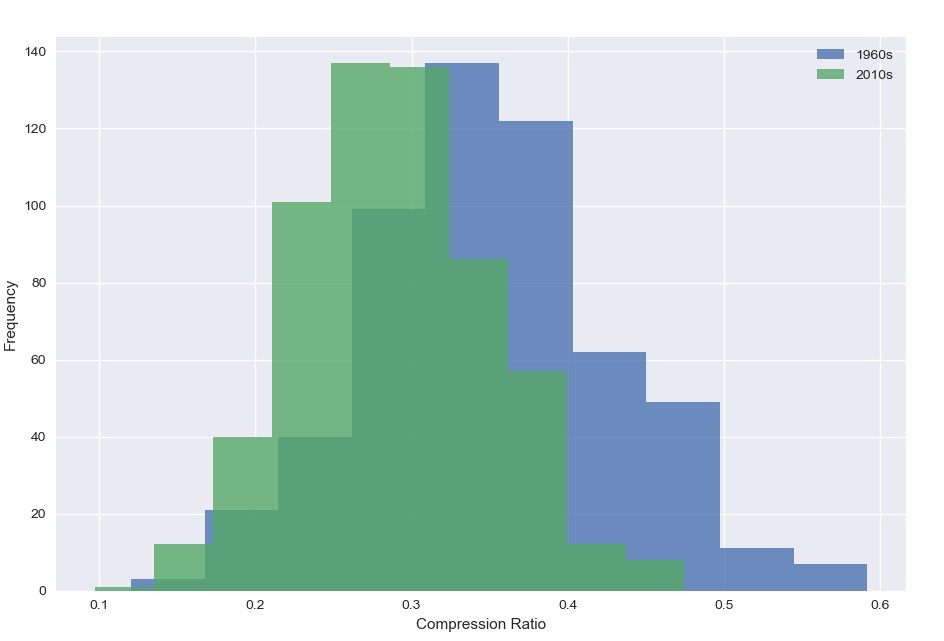
We can clearly see the difference. We can also look at the repetition by chart position, here we’ve got the compression ratio by decade, split out into all songs and just those in the top 10,
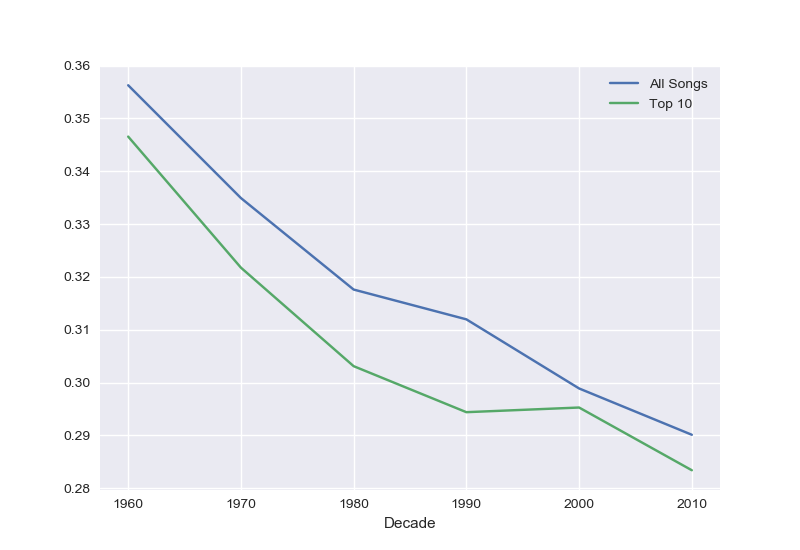
We can see that the top 10 got more compressible at the same rate as the whole, but for each decade the most popular songs were more repetitive than the average. Repetition sells.
One final thing we can do is look at the structure of repetition in a single song, and to do this we’ll borrow a tool from bioinformatics, called a dot plot. In this plot we represent a song as a square matrix, $(n_{words} \times n_{words})$, and place a dot everywhere a word repeats, e.g. if the first word is ‘The’ we place a dot at every index in the first row that corresponds to another ‘The’ in the song. This gives really nice plots that let us examine how groups of words repeat throughout a song, we can see the structure of the song directly. As an example here’s the dot plot for Hey, Jude by The Beatles
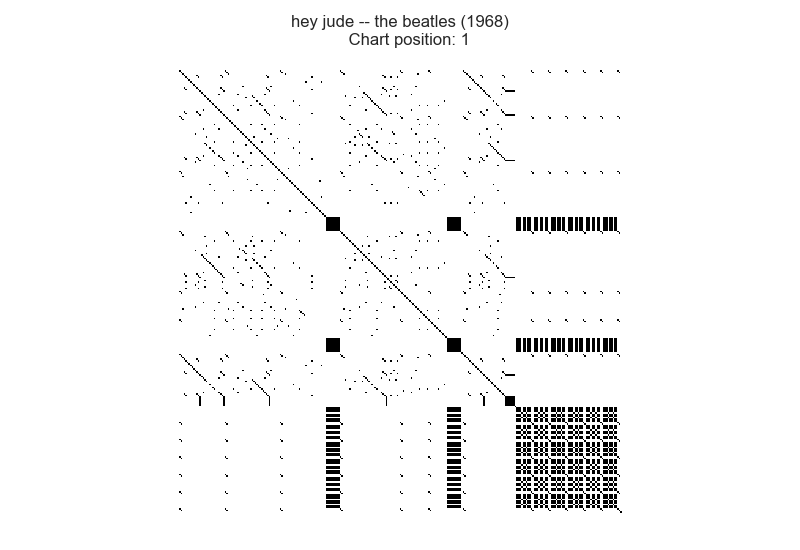
We can see these repeating patterns at regular intervals throughout the song, the verse-chorus structure, with a burst of repetition at the end (the “na na na” outro). Because these are cool to look at I’ve made a dot plot for every No. 1 in the data set, you can see them all here.