Premier League
With the 2018 Premier League season coming to an end I thought it would be a fun to take a quick look at some historic PL data.
First job is to collect the data. This site has a lot of data on soccer matches from various leagues, for this project I pulled down the results of every PL game.
| Div | HomeTeam | AwayTeam | FTHG | FTAG | Date |
|---|---|---|---|---|---|
| E0 | Charlton | Man City | 4 | 0 | 2000-08-19 |
| E0 | Chelsea | West Ham | 4 | 2 | 2000-08-19 |
| E0 | Coventry | Middlesbrough | 1 | 3 | 2000-08-19 |
| E0 | Derby | Southampton | 2 | 2 | 2000-08-19 |
| E0 | Leeds | Everton | 2 | 0 | 2000-08-19 |
Here we have all 9,627 PL games played from 1 Sept 1993 up to the week before last, their dates and full time scores.
Let’s begin by looking at a couple of summary statistics. First off the average goals per game
df[['FTHG', 'FTAG']].mean()

FTHG    1.524151
FTAG    1.122572
So it looks like home advantage is worth about $4 / 10^{\rm{th}}$’s of a goal a game, fluctuating a little season by season. How about team by team, who’s got the best home and away records? No prizes for guessing the best teams but I was a bit surprised at how far from the mean they are, both United and Arsenal have averaged more than 2 goals per home game, with Chelsea not much below
df.groupby('HomeTeam').FTHG.mean().sort_values(ascending=False).head(3)

Man United    2.157233
Arsenal       2.064854
Chelsea       1.997904
At the other end of the spectrum the average away team has scored more than 2 goals at Swindon
df.groupby('HomeTeam').FTAG.mean().sort_values(ascending=False).head(3)

Swindon      2.142857
Blackpool    1.947368
Cardiff      1.842105
Taking a look at average home team goals over all the games we get this
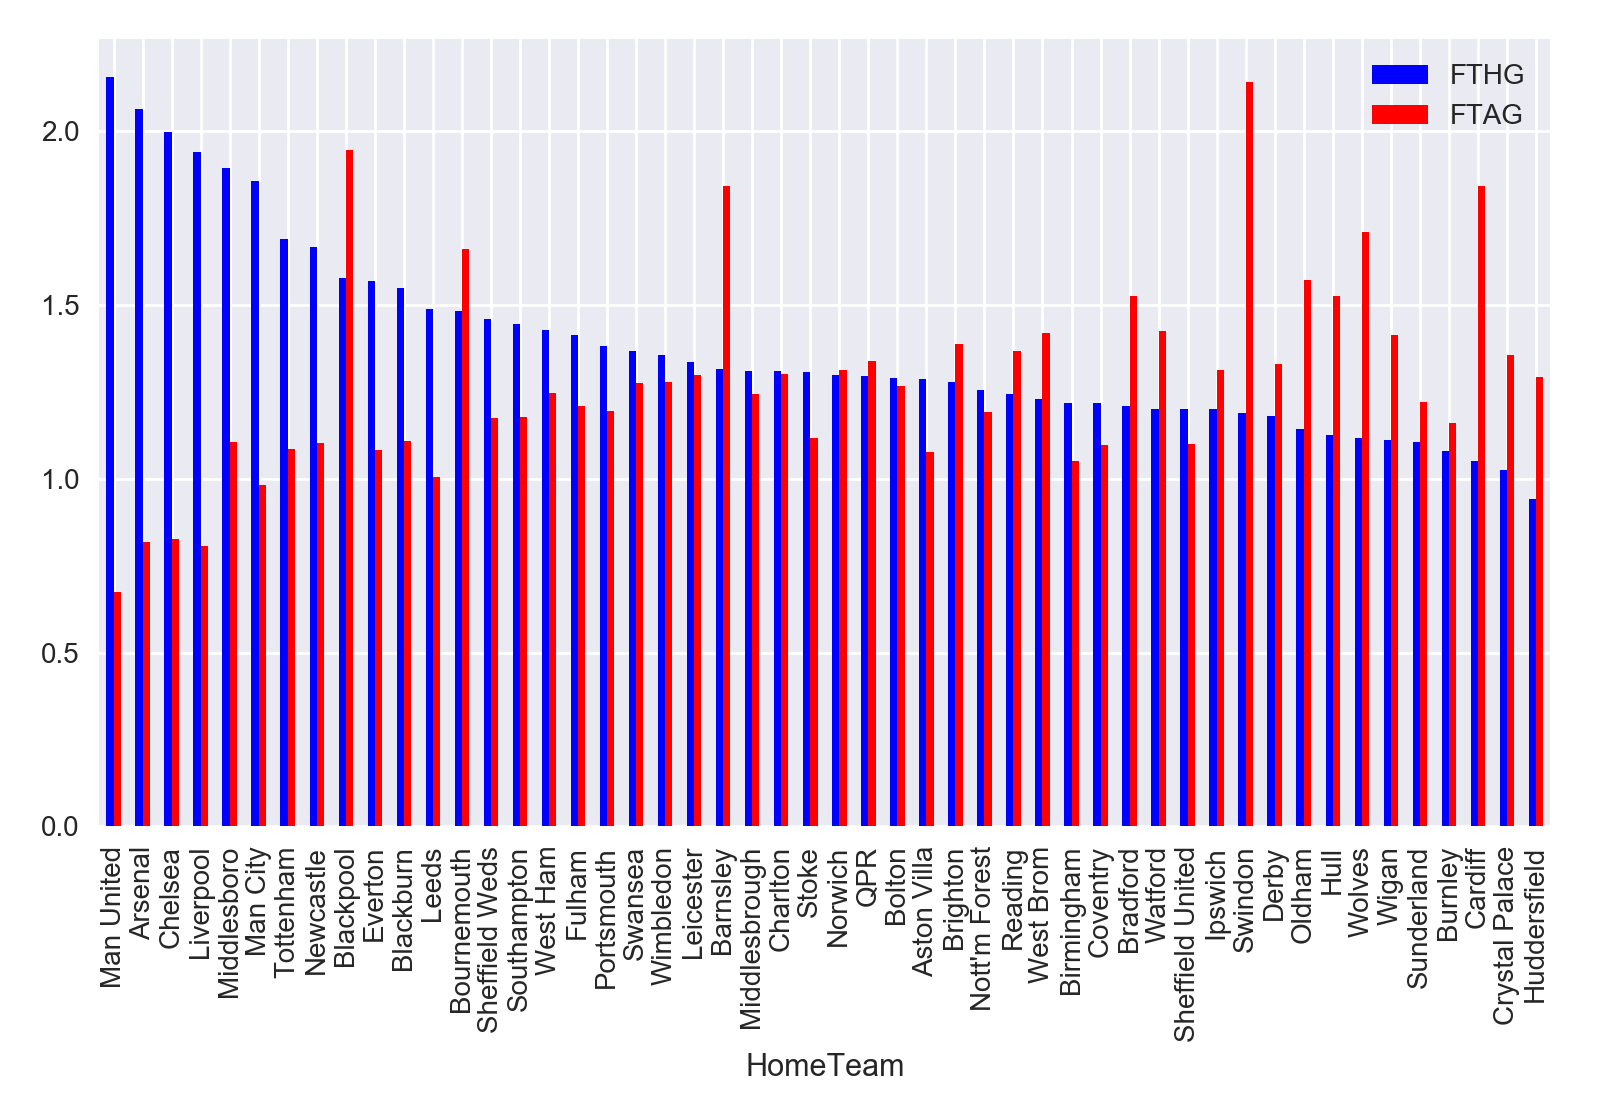
One interesting outlier here is Newcastle who score more than 1.5 goals on average at home, putting them well in the top half, but on average they’ve managed to concede almost 2 goals to the visiting team.
We can see how the top 5 teams have scored against one another in the past 20 years. Spurs an unfortunate outliers here, having scored the fewest and conceded the most in games against top opposition.
Next I decided to take a look at the cumulative results of each team in the league. To do this I sorted the data by date and iterated through it logging each teams results (1 for a win, 0 for a draw, -1 for a loss) and computed their cumulative sum. This gives a plot like this (made with MPLD3)
This is a lot of fun to play around with and you can see the rise and fall of various teams. For instance if you zoom you can see the Arsenal Invincible’s season, and United’s post-Fergie decline in form. One team that stands out here is Man City, you can see a real turn in fortunes. There’s a pretty clear elbow in the data, and I did some quick change-point analysis to quantify it
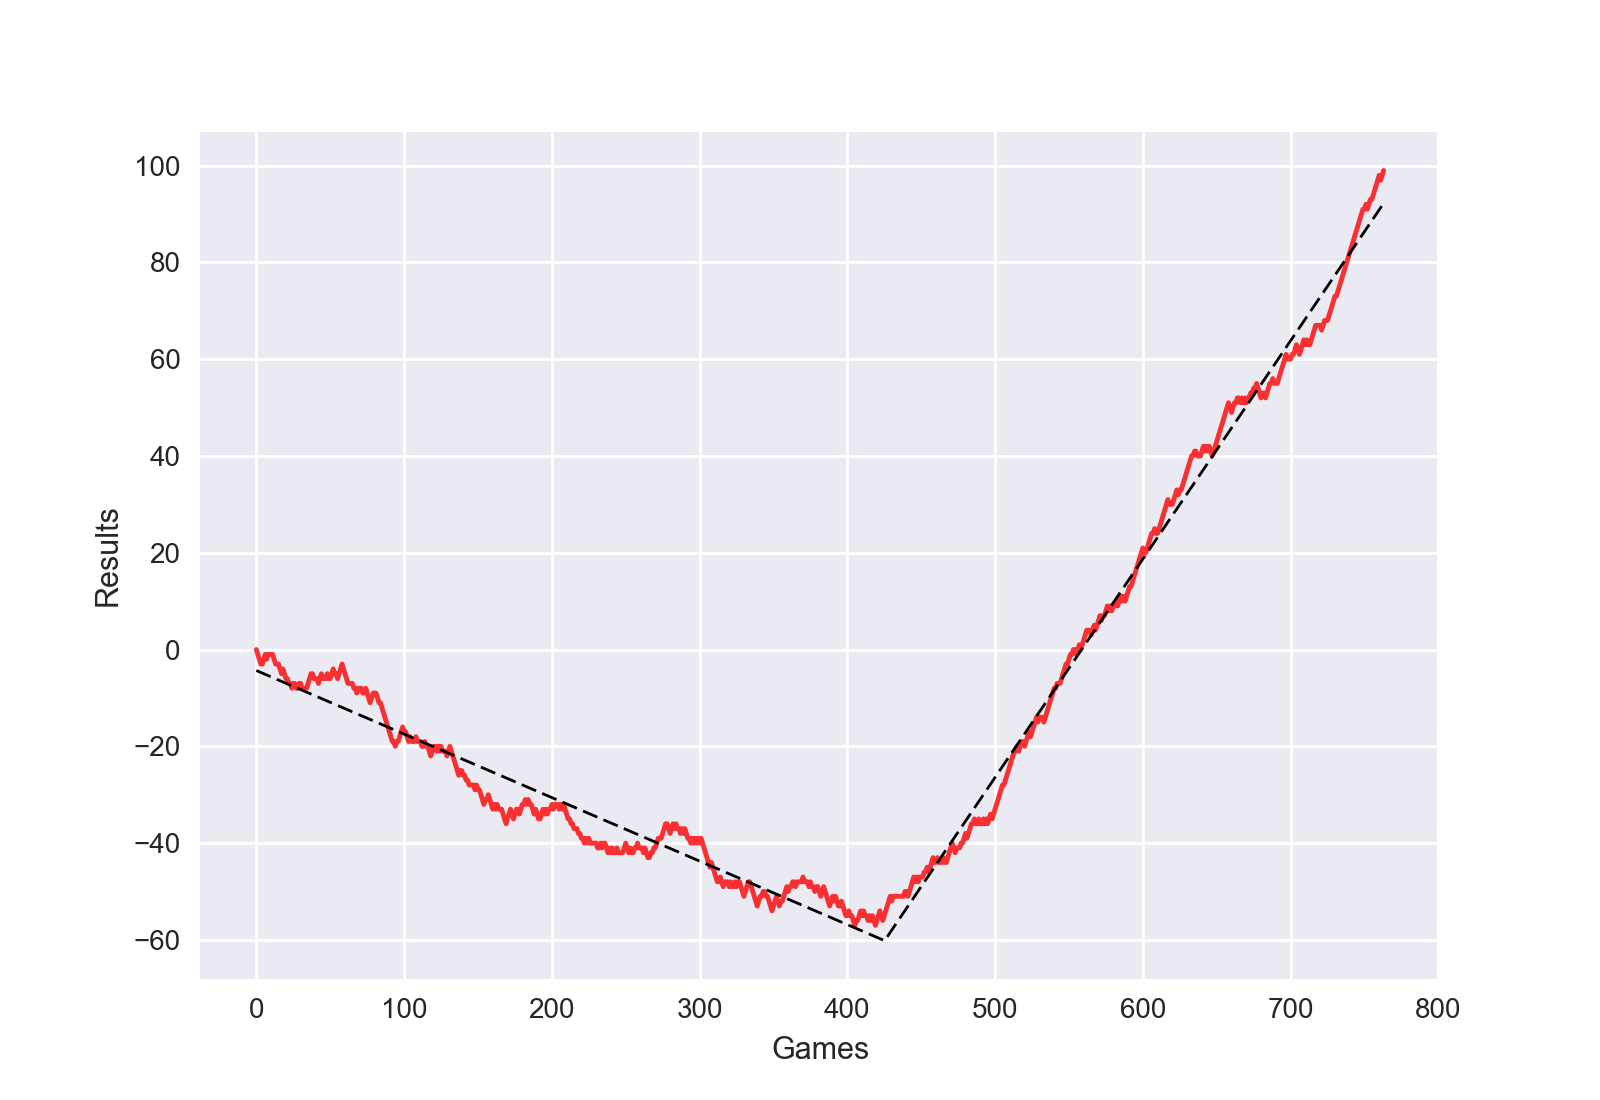
You can see that around game 400 City went from losing more games than they won to winning more than they lose. Unsurprisingly this corresponds to the 2008-09 season, when the club was bought by the Abu Dhabi Group and the following summer spent £100 million on players. If you look closely at the last 100 games I think you can also see the Pep effect.
This was a pretty brief look at things, but playing around with soccer data is something that I really enjoy so I reckon I’ll return at some point for a deeper dive.